Introduction
Most of the time when a developer has written an Expert Advisor, making sure that the Expert Advisor achieves its aim of good profitability is always a very tasking process. In this article, we will look at some of the major steps needed in testing and optimizing an Expert Advisor so that we will be able to achieve close to the desired goal of writing the Expert Advisor.
1. Identifying and Correcting Code Crrors
We will begin this article by looking at some common code errors normally encountered in the process of writing an Expert Advisor code. Most of the time beginners face some tough time identifying and correcting code errors when writing their codes or when modifying a code written by another developer. In this section we will look at how easy it is to use the MQL5 editor to identify and correct some of such errors.
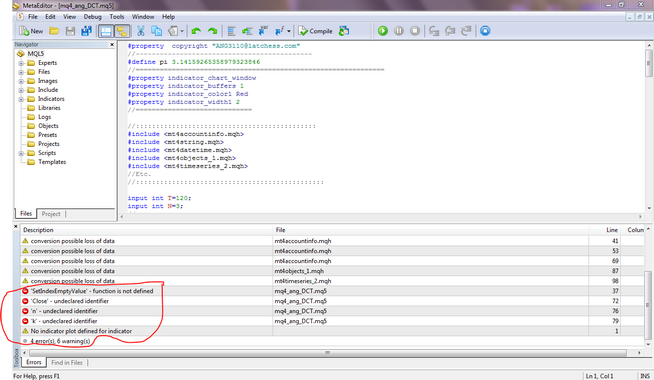
You have just completed writing the code and it seems everything should just work because you are almost certain that the code is error free. Or, it was a code that was written by someone else and you made a few changes and, alas! when you hit the Compile button (or press F7), you were presented by series of errors in the code as shown in the Error tab of the MetaEditor Toolbox window.

Figure 1. Compilation errors in an Expert Advisor code
Wow! 38 errors and 1 warning, your code may not have as much errors as shown here, all we want to look at are the various types of errors that are likely to show up when compiling our code and how we can resolve them. Let us describe the diagram above.
- The Section marked 1 shows the description of the error in the code. This is what gives us the idea of what the error looks like.
- The section marked 2 shows us in which file we have the error. This is very important if we have included files that have errors. With this we will be able to know which file we are to check for the error described.
- The section marked 3 shows us which line and column (on the line) in our code the error is located. This enables us to know which particular line to check for the error described.
- The section marked 4 shows the summary of the compilation errors and warnings.
Let us now begin to resolve the errors one after the other. Let us scroll up to the first line in the Error tab so that we can start from the beginning.

Figure 2. Identifying and resolving code errors
The first issue is described as : "truncation of constant value" and is discovered on line 16 column 20, to locate the exact line in our code, from the Edit menu of the MetaEditor, select Go to Line or press CTRL G on your keyboard.

Figure 3. Locating the error code line number
A dialog box will be displayed.

Figure 4. Locating error line number dialog
The range of number as shown on the dialog box is the total number of lines in the code. In this case (1-354) shows that our code contains 354 lines of code.
Type the line number you want to check in the box and click the OK button. You will be taken straight to the line number in the code. You will see the mouse cursor blinking on that particular line.

Figure 5. Cursor showing the error line number
The problem here is that we declare Lot as an integer (int) variable but initialize it with a double value (0.1). To correct this error we will change the int to double, save the file and then click COMPILE button again to see if that has been corrected.

Figure 6. Compile and save code after correction is made
On compiling again, the first issue has been resolved, but we still have more issues as shown below:

Figure 7. More errors shows up in code after compilation
We will now follow the same procedure as above and go to line 31. However, this time we will right-click on the error on the Errors tab and select Go to line

Figure 8. Another way of locating code error line
Or simply select the error and hit the Enter button on your keyboard. Immediately, you will be taken to the code line number 31.
You will see the mouse cursor blinking and also a small round red button (error icon) on that particular code line 31.

Figure 9a. Locating the code error line
However, if it is a warning message like the first one on line 16 that we corrected earlier, it will show a triangular yellow button (warning icon):

Figure 9b. Locating the code error line
It is very obvious that we don’t have any problem on line 31, but the error description says: "'STP' - unexpected token" .
We then must check the previous code line (that is line 30) to see what may be wrong. On close examination, semicolon is missing after "double ccminb = -95.0000" on line 30, that is why we have that error on line 31. We will now fix this error by typing the semicolon after -95.0000 and compile the code again.
Now the line 31 errors are gone. Next is line 100 as shown below:

Figure 10. More errors still exist in code
Hey Olowsam, must we be compiling after each correction, why don’t we just go to through all the lines at the same time and after we have done all the corrections then we compile the code once instead of compiling after each correction?
Did you just ask this question?
You may be right in a way, but I will not advise that. Problems are always resolved one after the other – Step by Step. Any attempt to lump problem together and solve them at once may lead to many headaches. You will soon understand why… just be patient with me.
Back to our problem, we are to check line 100 for the next error. The error states : "'if' - expressions are not allowed on a global scope" And I am sure that the if expression in line 100 is not on a global scope, but why are we having this error. Please let us go to line 100.

Figure 11. Locating the error in the code
We can't find any problem on line 100 and because we just finished correction line 31, we are sure that the problem now is between line 32 and line 99. So let us move upward to line 99 (we have a comment , so it can't be the error). If we also look upwards to the declarations (MqlTick, MqlTradeRequest and MqlTradeResult), they are correctly declared and punctuated.
Next let us look at the code for the if expression before these declaration code lines and see if the expression is okay. On very close study, we discover that the if expression has a closing brace, but no opening brace.

Figure 12. Looking above the error line number to identify error
Add the opening brace and compile the code again.
int Mybars=Bars(_Symbol,_Period);
if(Mybars<60) {
Alert("We have less than 60 bars, EA will now exit!!");
return;
}Once the code was compiled; errors on line 100, 107, 121, 126, 129, etc were completely cleared and new ones show up. See why it is good to follow step by step?

Figure 13. More errors still exist in code
Next we move to line 56 with two errors : "'cciVal1' - parameter conversion is not allowed" and "'cciVal1' - array is required"
On closer look at line 56, cciVal1 is supposed to have been declared as an array. Could it be that we did not declare it as an array but now trying to use it as an array? Let us check the declaration section to confirm this before we can know what next to do.
int maHandle;
int cciHandle1,cciHandle2;
double maVal[];
double cciVal1,cciVal2[];
double p1_close,p2_close;
From, here, we can see that we mistakenly declare cciVal1 as a double rather than as a dynamic array because we omitted the square brackets ([]). Let us add the square brackets (just as we have for cciVal2[]) and then compile the code.
int maHandle;
int cciHandle1,cciHandle2;
double maVal[];
double cciVal1[],cciVal2[];
double p1_close,p2_close;

Figure 14. Errors in code has been reduced considerably
What! So many errors have disappeared. We only corrected error reported on line 56 and some other errors were resolved automatically. This is because, the error reported on line 56 was responsible for those other errors. This is why it is good to follow a step by step process in resolving errors in your code.
We will now move to the next reported error on line 103 : "'GetLastError' - undeclared identifier" Wait a minute, GetLastError is supposed to be a function… Let go to line 103 to see what the problem is.
if(!SymbolInfoTick(_Symbol,latest_price))
{
Alert("Error getting the latest price quote - error:",GetLastError,"!!");
return;
}
The problem is actually on line 103. GetLastError is a function and every function needs a pair of parenthesis for input parameters. Let us type an empty pair of parenthesis and then compile the code. The empty pair of parenthesis indicates that the function takes no arguments or parameters.
if(!SymbolInfoTick(_Symbol,latest_price))
{
Alert("Error getting the latest price quote - error:",GetLastError(),"!!");
return;
}
Next, we move to line 159 : "'=' - l-value required" and a warning : "expression is not Boolean" Let us go to line 159 and see what this error means.
else if(PositionGetInteger(POSITION_TYPE) = POSITION_TYPE_SELL)
{
Sell_opened = true; It can be seen here that we assigned the value of POSITION_TYPE_SELL to PositionGetInteger(POSITION_TYPE) in the if statement and this is not what we intend to do. We wanted to make comparison instead. We will now change the expression to use equal operator rather than using an assignment operator. (that is ‘==’ instead of ‘=’). Make the correction and compile the code.
else if(PositionGetInteger(POSITION_TYPE) == POSITION_TYPE_SELL)
{
Sell_opened = true; Good! Now we have one more to go. Let us go to line 292 to see why it says "'PositionsTotal' - undeclared identifier" . Wait a minute, can you remember that we have seen an error like this before? ‘GetlastError’ line 103. Possibly, we forget to add the pair of parenthesis for PositionsTotal too, since it is a function. Let us go to line 292 to confirm.
bool CheckTrade(string otyp)
{
bool marker = false;
for (int i=1; i<=PositionsTotal;i++)
{Just like we suspected, it is because we forgot to add the pair of parenthesis for the function PositionsTotal. Now add the pair of parenthesis (PositionsTotal()) and compile the code. Let me also state that, it is possible to get this error if we actually use a variable which we did not declare anywhere in the code.

Figure 15. All compilation Errors has been completely resolved
Wonderful! Now we have been able to correct all the compilation errors. It is now time to debug our code and see if there are run-time errors. Here, we will not be going into the details of how to debug our code as it has already been explained in this article.
As the debug session begins, we notice another error :

Figure 16. Runtime error observed during debugging of code
Click the OK button and you will be taken to the line of code that generates the error.

Figure 17. Identifying the line of code that generates run-time error
The error is generated by this code on line 172 as you can see from the figure above. Since the error is an "Array out of range" error, it means that the value we intend to get from the array is out of the range of the array values available. So we will now go to the line where we copy the indicator buffers into arrays to see what the problem is.
if(CopyBuffer(maHandle,0,0,3,maVal)<0)
{
Alert("Error copying MA indicator Buffers - error:",GetLastError(),"!!");
return;
}
if(CopyBuffer(cciHandle1,0,0,3,cciVal1)<0 || CopyBuffer(cciHandle2,0,0,3,cciVal2)<0)
{
Alert("Error copying CCI indicator buffer - error:",GetLastError());
return;
}We can observe from the CopyBuffer functions that we have only copied three values (Bar 0, 1, and 2) which means that we can only access array values of maVal[0], maVal[1], and maVal[2] and also cciVal1[0] , cciVal1[1] and cciVal1[2], etc. But in our code on line 172, we were trying to get the array value for cciVal1[3]. This is why the error was generated. Now, stop the debugger so that we can fix the error:

Figure 18. Stop debugger to correct error in code
To fix this we need to increase the number of records to be copied from Indicator buffers to 5 so that we will be able to obtain array values of cciVal1[0], cciVal1[1], cciVal1[2], cciVal1[3], and cciVal1[4] if need be.
if(CopyBuffer(maHandle,0,0,5,maVal)<0)
{
Alert("Error copying MA indicator Buffers - error:",GetLastError(),"!!");
return;
}
if(CopyBuffer(cciHandle1,0,0,5,cciVal1)<0 || CopyBuffer(cciHandle2,0,0,5,cciVal2)<0)
{
Alert("Error copying CCI indicator buffer - error:",GetLastError());
return;
}Correct the code as shown and then start the debugger again. This time, no more errors as we notice our Expert Advisor performing trade actions

Figure 19. All errors corrected, Expert Advisor performs trade during debugging
2. Testing the Expert Advisor
Once we are sure that our code is error free, it is now time to test the Expert Advisor to be able to get the best settings that will give us the best results. In order to carry out the test, we will use the Strategy Tester, a program which is built into the MetaTrader terminal. To launch the Strategy Tester, Go to View menu on the Terminal and select Strategy Tester.

Figure 20. Launching the Strategy Tester
2.1. Preliminary Testing of our Expert Advisor
At this point, we want to test our Expert using the available symbols in the Market Window. With this result we will be able to guess which currency pairs we can better optimize our Expert for. Make sure the Market Window contains most of the currencies you are targeting for the Expert.
Select the Expert on the Strategy Tester Settings Tab, select the period/timeframe you have in mind (and of course you can also test it for different timeframes) and then Select 'All Symbols Selected in MARKET Watch' in the optimization field. Directly in-front is the Optimization results parameter, select Balance + max Profit Factor.

Figure 21. Preliminary test of Expert Advisor with all symbols in the Market Watch window
1. Select the tick generation mode –(Every Tick)
2. Select Optimization Type –(All Symbols Selected in MARKET Watch)
3. Select type of expected Result from optimization
You can get the details of the various optimization types from the terminal help documentation. We are not forward testing, so leave Forward as No.
For this test, the main values/parameters (highlighted in green) in the Inputs tab will be used.

Figure 22. Preliminary test input parameters
Once you are done, switch over to the Settings tab and click the Start button. On completion of the test, you will see a message in the Journal Tab similar to the following:

Figure 23. Preliminary test completed
Once the test is completed, go to the Optimization Results Tab to see the results.

Figure 24. Preliminary test optimization results
Our interest is in the symbol that gives the highest Result based on our setting – (Balance + max Profit Factor). To get this, let us sort the result by clicking on the Result title such that the symbol with the highest result is listed at the top.

Figure 25. Preliminary optimization result analysis
From this result, we can see that our Expert Advisor can be profitable for the following symbols (EURUSD, EURJPY, AUDUSD) in the timeframe we have selected. You can further perform this test for another timeframe, say, 30mins and see what you have. This should be taken as an assignment and please share the result so that we can all learn too.
From the result of our preliminary test, we will now decide which symbol(s) and timeframe(s) we are going to optimize our Expert Advisor for.
In this example, we will optimize our Expert Advisor for the EURUSD and 1 Hour timeframe. What are the things that motivate the choice we just made:
The Profit factor is the ratio of the total profit to that total loss for that test. The higher the Profit factor the more profitable your trading strategy is.
This refers to the relative drawdown of the equity or the largest loss (in percent) from the maximal value of equity. The lower the Drawdown (in percent), the better the strategy.
This is the ratio of the profit to the maximal drawdown. It reflects the riskiness of the trading strategy.
Having decided on the symbol and timeframe to use, it is now time to optimize our Expert Advisor.
2.2. Optimizing the Expert Advisor
Optimization is simply a process of fine-tuning the performance of our EA by testing with various factors (parameters) that determines the effectiveness or profitability of our Strategy coded in the EA. It is a similar procedure to testing, but instead of testing the EA only once, it will be tested many times depending on the parameters selected in the Input tab.
To begin, we go to the settings tab and enable optimization and then select the type of result we want from our optimization.

Figure 26. Optimization settings for Expert Advisor
1. Select the tick generation mode –(Every Tick)
2. Select Optimization Type –(Fast Genetic Based Algorithm)
3. Select type of expected Result from optimization (here we select Balance + Max Profit Factor)
You can get the details of the various optimization types from the terminal help documentation. We are not forward testing, so leave Forward as No. Having set the optimization properties, let us set the parameters to be used for the optimization in the Inputs tab.

Figure 27. Optimization Input parameters
Since we are optimizing, we will only concentrate on the areas highlighted in yellow. First of all, any parameter we do not want to use in the optimization must be unchecked. In order words, we will only check the parameters we want to use in the optimization of the EA. Here, I have checked five parameters, but you may decide to check only one or two depending on the parameters that the effectiveness of your strategy is based on. For example, you may check only the Moving Average and CCI periods such that the optimization result will let you know the best value for each of the Indicators that give your EA the best performance. This is the main essence of optimizing.
Also, the number of parameters checked will determine the total number of tests that your EA will go through. You will soon see what I am talking about.
Setting The Values
Start:
This is the starting value to be used for the selected variable for optimization. Let us use the Stop Loss variable to explain how to set the values. For the Stop Loss, we have asked the tester to start with a value of 30. This will be the minimum value that will be used for Stop Loss during the optimization.
Step:
This is the incremental value for the Stop Loss. If we set an increment of 2; it means that, if in the first test, it uses 30 for Stop Loss it will use either 32, 36, 34 etc. in the second… It does not mean that it will use 30, then followed by 32, 34 etc. No, it selects the values at random but they will always be multiples of two (2) between the Start value and the Stop value.
Stop:
This is the maximum or highest value that will be used for the optimization. Here we specified 38. This means that the values that will be used for the testing will be between 30 and 38 but will be values which are multiples of 2. It will not use 40 or any value greater.
The total number of tests that will be carried out depends on the settings of these three sections. In our example, the tester will combine a total of 5 possibilities alone for the Stop Loss as shown in the Steps column on the Inputs Tab, it will combine a total of 8 possibilities for the Take Profit, etc. By the time you consider all the other variables, it will be getting to hundreds or thousands of possibilities (tests/passes). If you don't want to wait for ages in order to optimize a single EA, make sure you don't include or check too many variables; maybe just two or three that the performance of your EA really depends on (most especially, the indicator periods, if you use them in your own code). Also you must make sure your step value will not result in having too many possibilities (tests). For example, if we use 1 as the step value, then we have increased the number of attempts for the Stop Loss alone to 10. Well, as said earlier, the total time required to complete an optimization session depends on the total number of available agents you have setup on your system.
I believe the explanation is sufficient.
Once we have finished setting the inputs, we now go back to the Settings tab and click the Start Button.
Once the optimization is completed, we can see the details on the journal tab.

Figure 28. Optimization completed as shown in the Journal tab
To view the results as each test is passed or completed, we go to the Optimization Results tab. And it is always good to sort the output by the Results so that we can easily identify the settings that gives us the best result based on our optimization setting. Clicking on the Result heading within the optimization Results tab will arrange the results in either ascending or descending order

Figure 29. Optimization report
Switch over to the Optimization Graph tab to see how the graph looks like.

Figure 30. Optimization graph
Don’t understand what you see? Don’t worry; the dots you see is a plot of the number of tests your EA passed against the optimization result based on the optimization result type you selected. In our case we selected Balance + max Profit factor.
2.3. Interpreting the result
To successfully interpret the optimization report, go to the Optimization Results tab. You will discover that you cannot see some fields like, Profit factor, Expected Payoff, Drawdown %, etc . To see them, right-click anywhere in the Optimization Results tab and select the additional information you wish to see as shown below:

Figure 31. Selecting Drawdown% in optimization result

Figure 32. Selecting Profit Factor in optimization result
Having added these additional records, we will now analyze the Optimization result to decide the best settings for our Expert Advisor.

Figure 33. Analyzing the optimization result
From the above figure, the highlighted sections labeled A and B indicates the best results for our Expert Advisor. Now the choice you make is completely yours, It all depends on what you are looking for. However, here we are interested not only in the settings that give the highest profit, but also have a lower drawdown%.
As you can see, the section A (highlighted in yellow) has the best result (Balance + max Profit Factor) of 22381.71 with a profit of 924.10 while the section B (highlighted in green) has the second best result of 22159.25 but with a higher profit of 936.55. Section A had a lower Drawdown% of 1.78 while B has a higher drawdown of 1.95.
The Strategy Tester saves the optimization results to the"<Client terminal data folder>\Tester\cache" folder. In your case all the optimization data will be saved to the cci_ma_ea.EURUSD.H1.0.xml file,
The file name has the following form: ExpertName.SYMBOL.PERIOD.GenerationMode.xml, where:
- ExpertName - Expert Advisor Name;
- Symbol - symbol;
- Period - timeframe (M1,H1,...)
- GenerationMode - tick generation mode (0-every tick, 1 - one minute OHLC, 2 - open prices only).
The XML files can be opened by MS Excel.
2.4. Choosing the Best Result
To finally obtain the best result, we need to look at the Optimization graph again. Switch back to the Optimization graph. Right-click anywhere within the graph and select 1D Graph.

Figure 34. Select 1-dimensional (1 D) graph for result analysis
With this we can easily see the values of each of the input parameters that give the best result. You can now begin to choose each parameter to be able to see the best value. Right-click on the graph and select X-Axis and then select the parameter you want to check. It will look like below (for Stop loss)

Figure 35. Getting the best StopLoss value from the optimization result
Actually, from the optimization result, it is very clear that the best Stoploss is 34, the best TakeProfit is 78, and the best CCI_Period1 is 62. To obtain the best values for the MAPeriod and CCI_Period2, select each of them as above

Figure 36. Getting the best Moving Average Period value from the optimization result
This graph shows a value of 26 as the MA_Period with the best result.

Figure 37. Getting the best CCI_Period1 value from the optimization result
This graph shows a value of 62 as the CCI_Period1 with the best result.

Figure 38. Getting the best CCI_Period2 value from the optimization result
This graph shows values of 28 or 30 as the CCI_Period2 with the best results.
Having obtained the best values for each parameter, it is now time for the final testing of our Expert Advisor.
2.5. The Final Test
The final test involves putting together the best parameters for the testing of the Expert Advisor. In this case, we will use the best values we discovered in the INPUT section of the Strategy Tester as shown below.

Figure 39. The final test input parameters
In the SETTINGS tab of the Strategy Tester, we will disable Optimization as shown below

Figure 40. The final test settings
We will now click the START button to begin the test. Once the test is completed, we have the results on the RESULTS tab as shown below

Figure 41. The final test results
And likewise, we have the graph for the test on the GRAPH tab

Figure 42. The final test graph result
Conclusion
In this article, we have discussed the ways to identify and correct code errors and we have also discussed how to test and optimize an Expert Advisor for the best symbol from the market watch.
With this article, I believe checking code for errors using the editor and optimizing and testing of Expert Advisors using the Strategy Tester makes writing a better and profitable Expert Advisor possible.